Stop presenting numbers you can’t defend. Agent Q delivers 87% forecast accuracy, surfaces at-risk deals before your Monday call, and gives your team a single number – every week, every quarter.
Forecast accuracy with Agent Q
Win rate improvement
Avg deal close
(vs 47d)

Reps sandbag, managers over-commit. I find out on Friday what I should have known on Monday.

Dropped from 58% to 41% this year. I don’t know which reps, which stages, or which competitors.

$380K/year in tools that don’t agree with each other. My RevOps spends Monday reconciling them.

A $280K deal in Commit was dead. Nobody flagged it. I found out when it was supposed to close.
Powered By Q
Meet Q
HOW QH SOLVES IT
Every Feature Below Maps Directly To A CRO Pain Point. None Of It Requires A Consultant To Configure, A Developer To Maintain, Or A Spreadsheet To Validate.
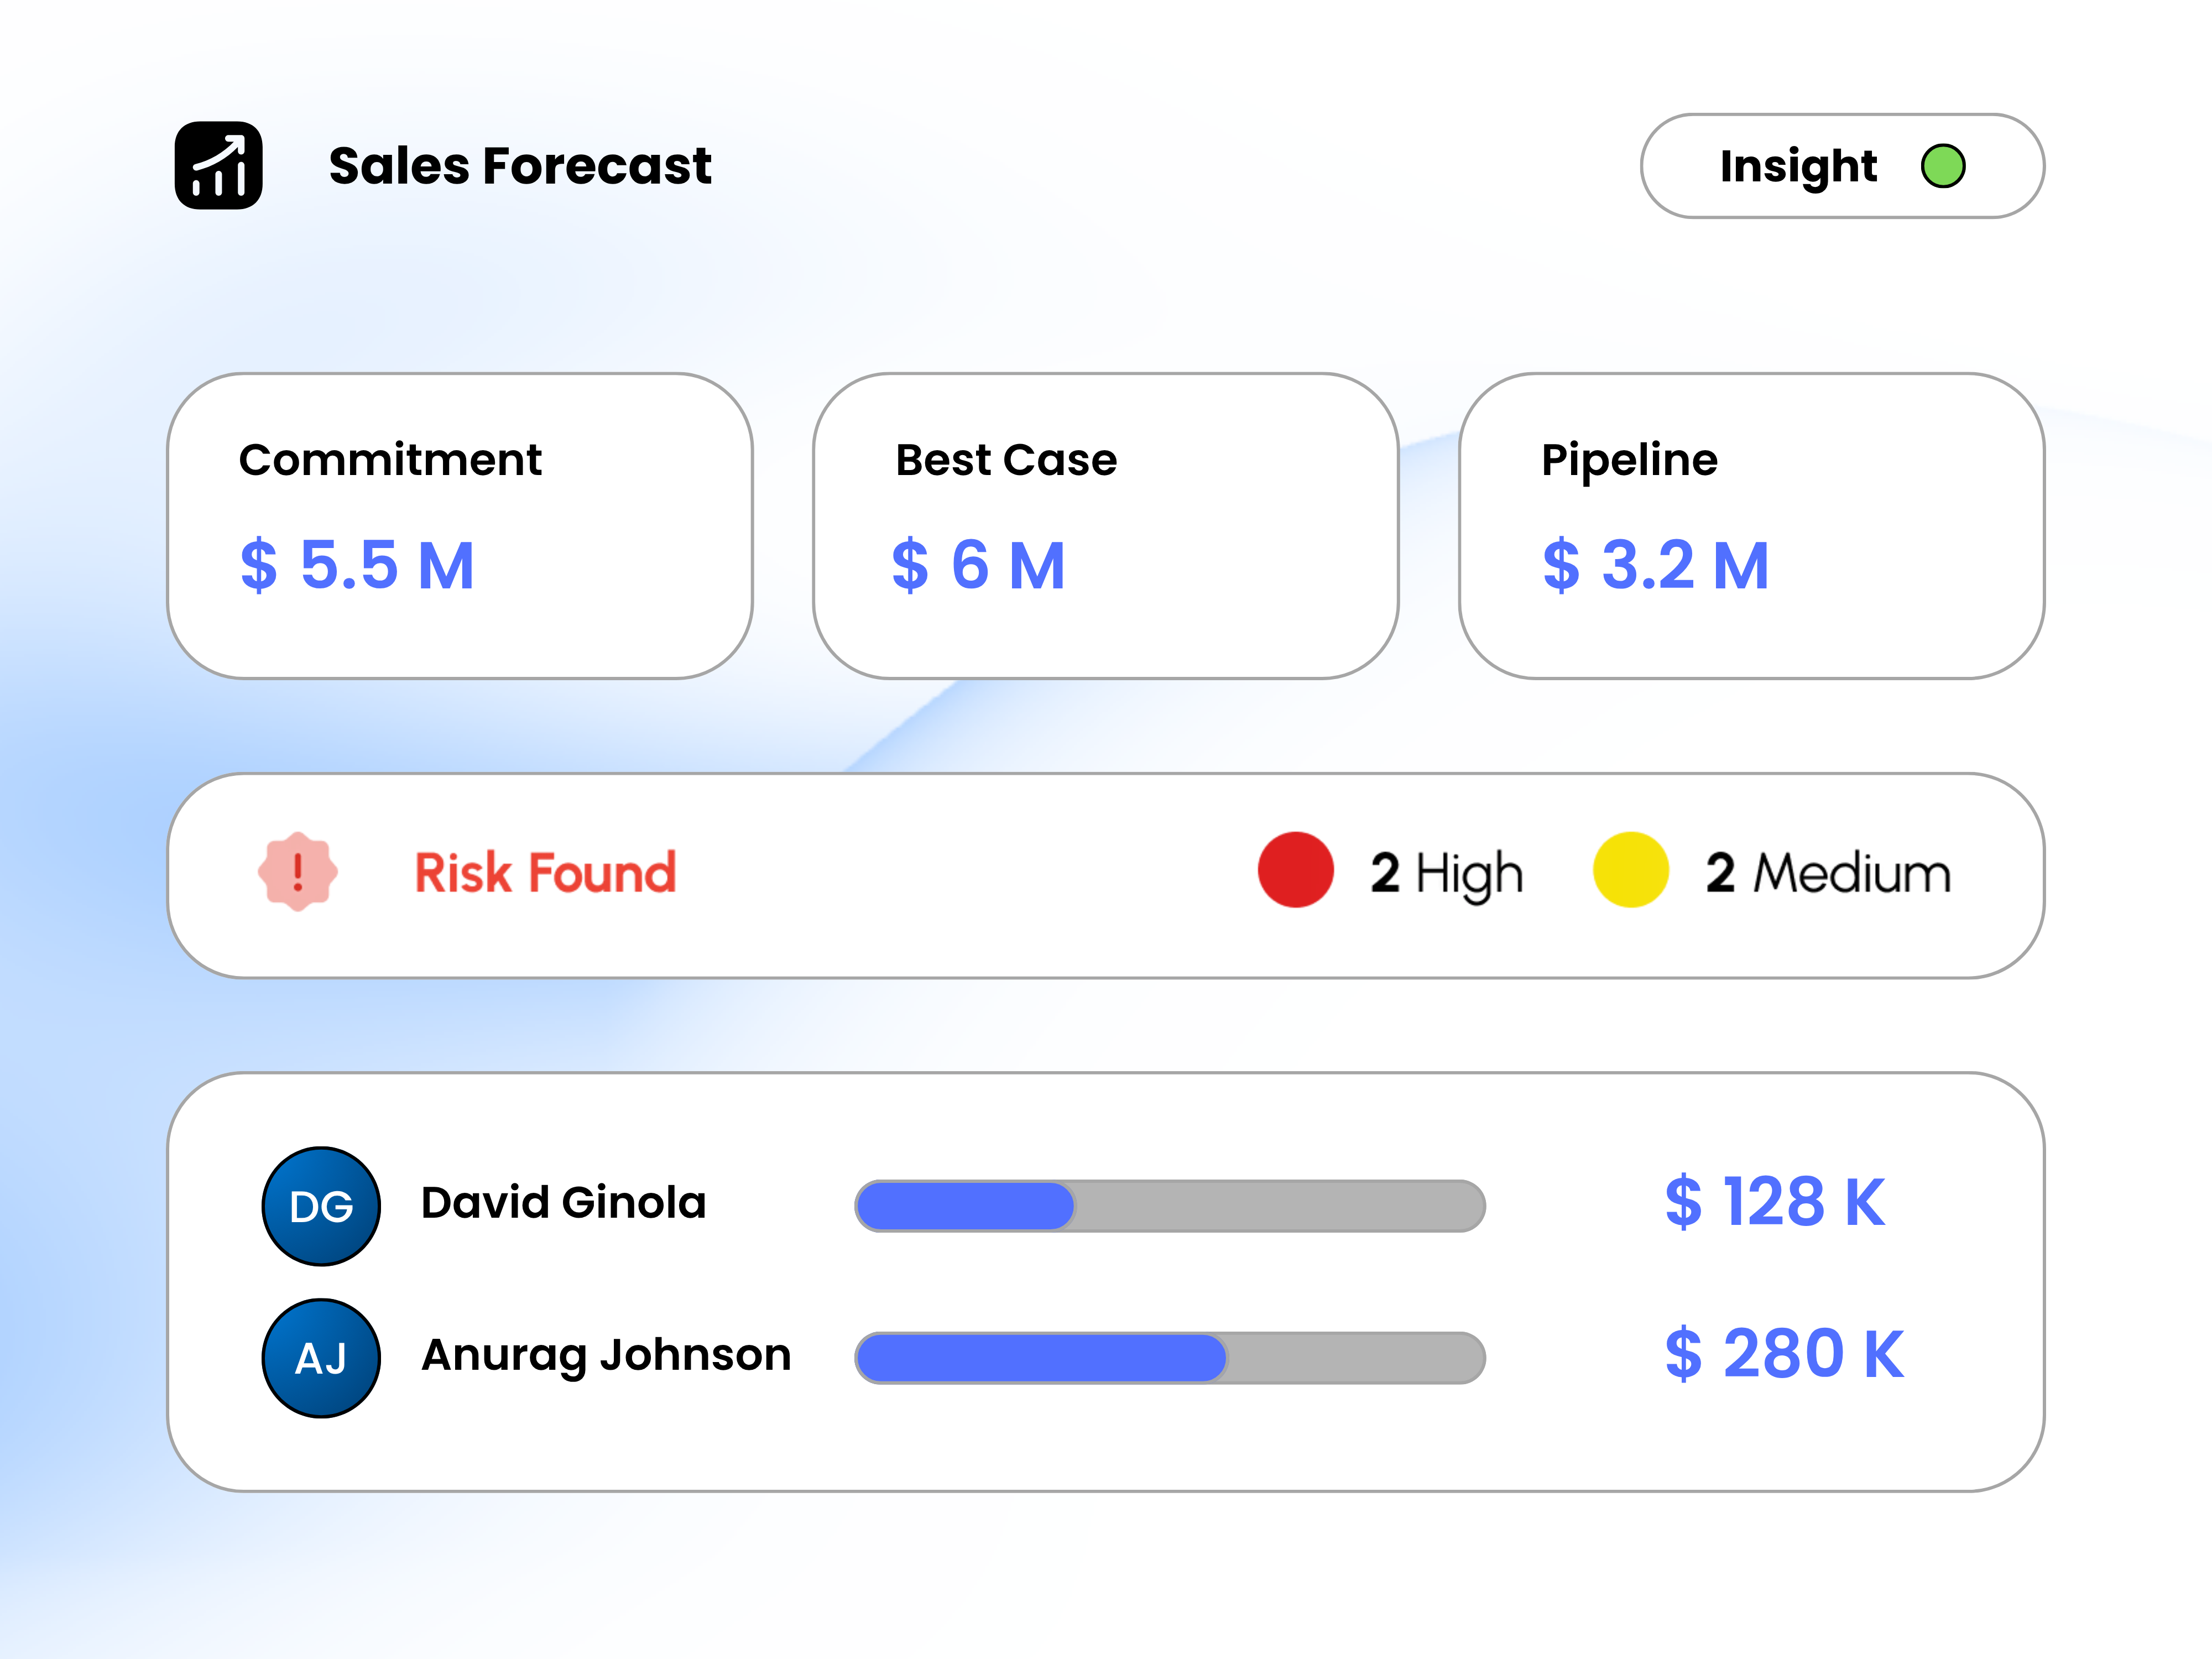
Agent Q analyses every deal signal – activity frequency, stakeholder engagement, stage velocity, competitor presence – and generates Commit, Best Case, and Pipeline categories with confidence scores. No more gut-feel adjustments.
Forecast accuracy with Agent Q
vs 46% industry average – NimbusTech, 42 reps, Singapore
HOW QH SOLVES IT
Every Feature Below Maps Directly To A CRO Pain Point. None Of It Requires A Consultant To Configure, A Developer To Maintain, Or A Spreadsheet To Validate.
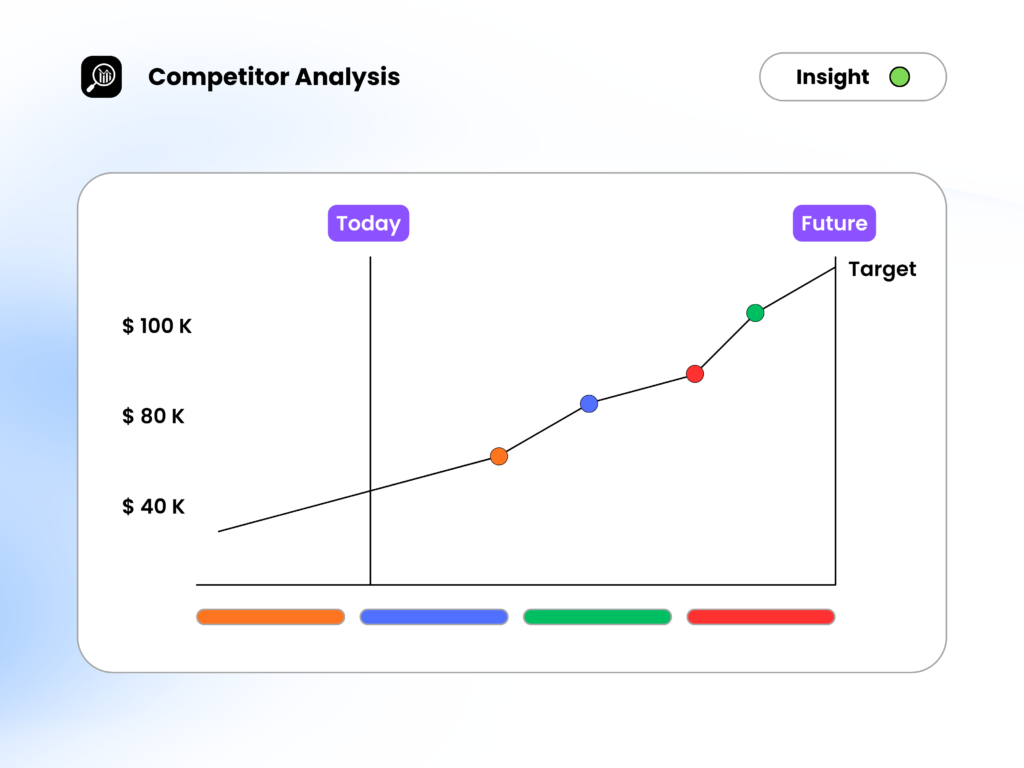
Agent Q cross-references every closed won and closed lost deal to surface the patterns that separate your top performers from your average reps. Win rate by stage, by competitor, by rep, by deal size – all without building a single report.
Win rate improvement on average
Measured at 90 days post-deployment – QH customer benchmark
HOW QH SOLVES IT
Every Feature Below Maps Directly To A CRO Pain Point. None Of It Requires A Consultant To Configure, A Developer To Maintain, Or A Spreadsheet To Validate.
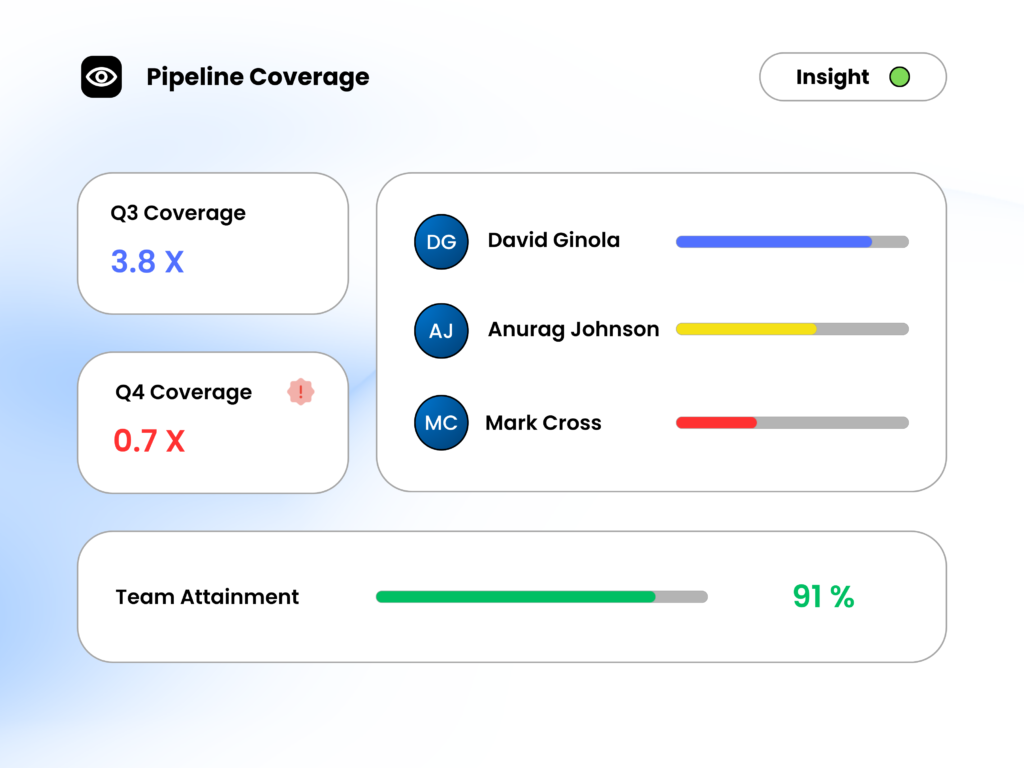
Agent Q monitors pipeline coverage ratios forward-looking, alerts you when a future quarter is under-covered, and identifies which territories, products, or segments are generating the weakest pipeline before it becomes a board problem.
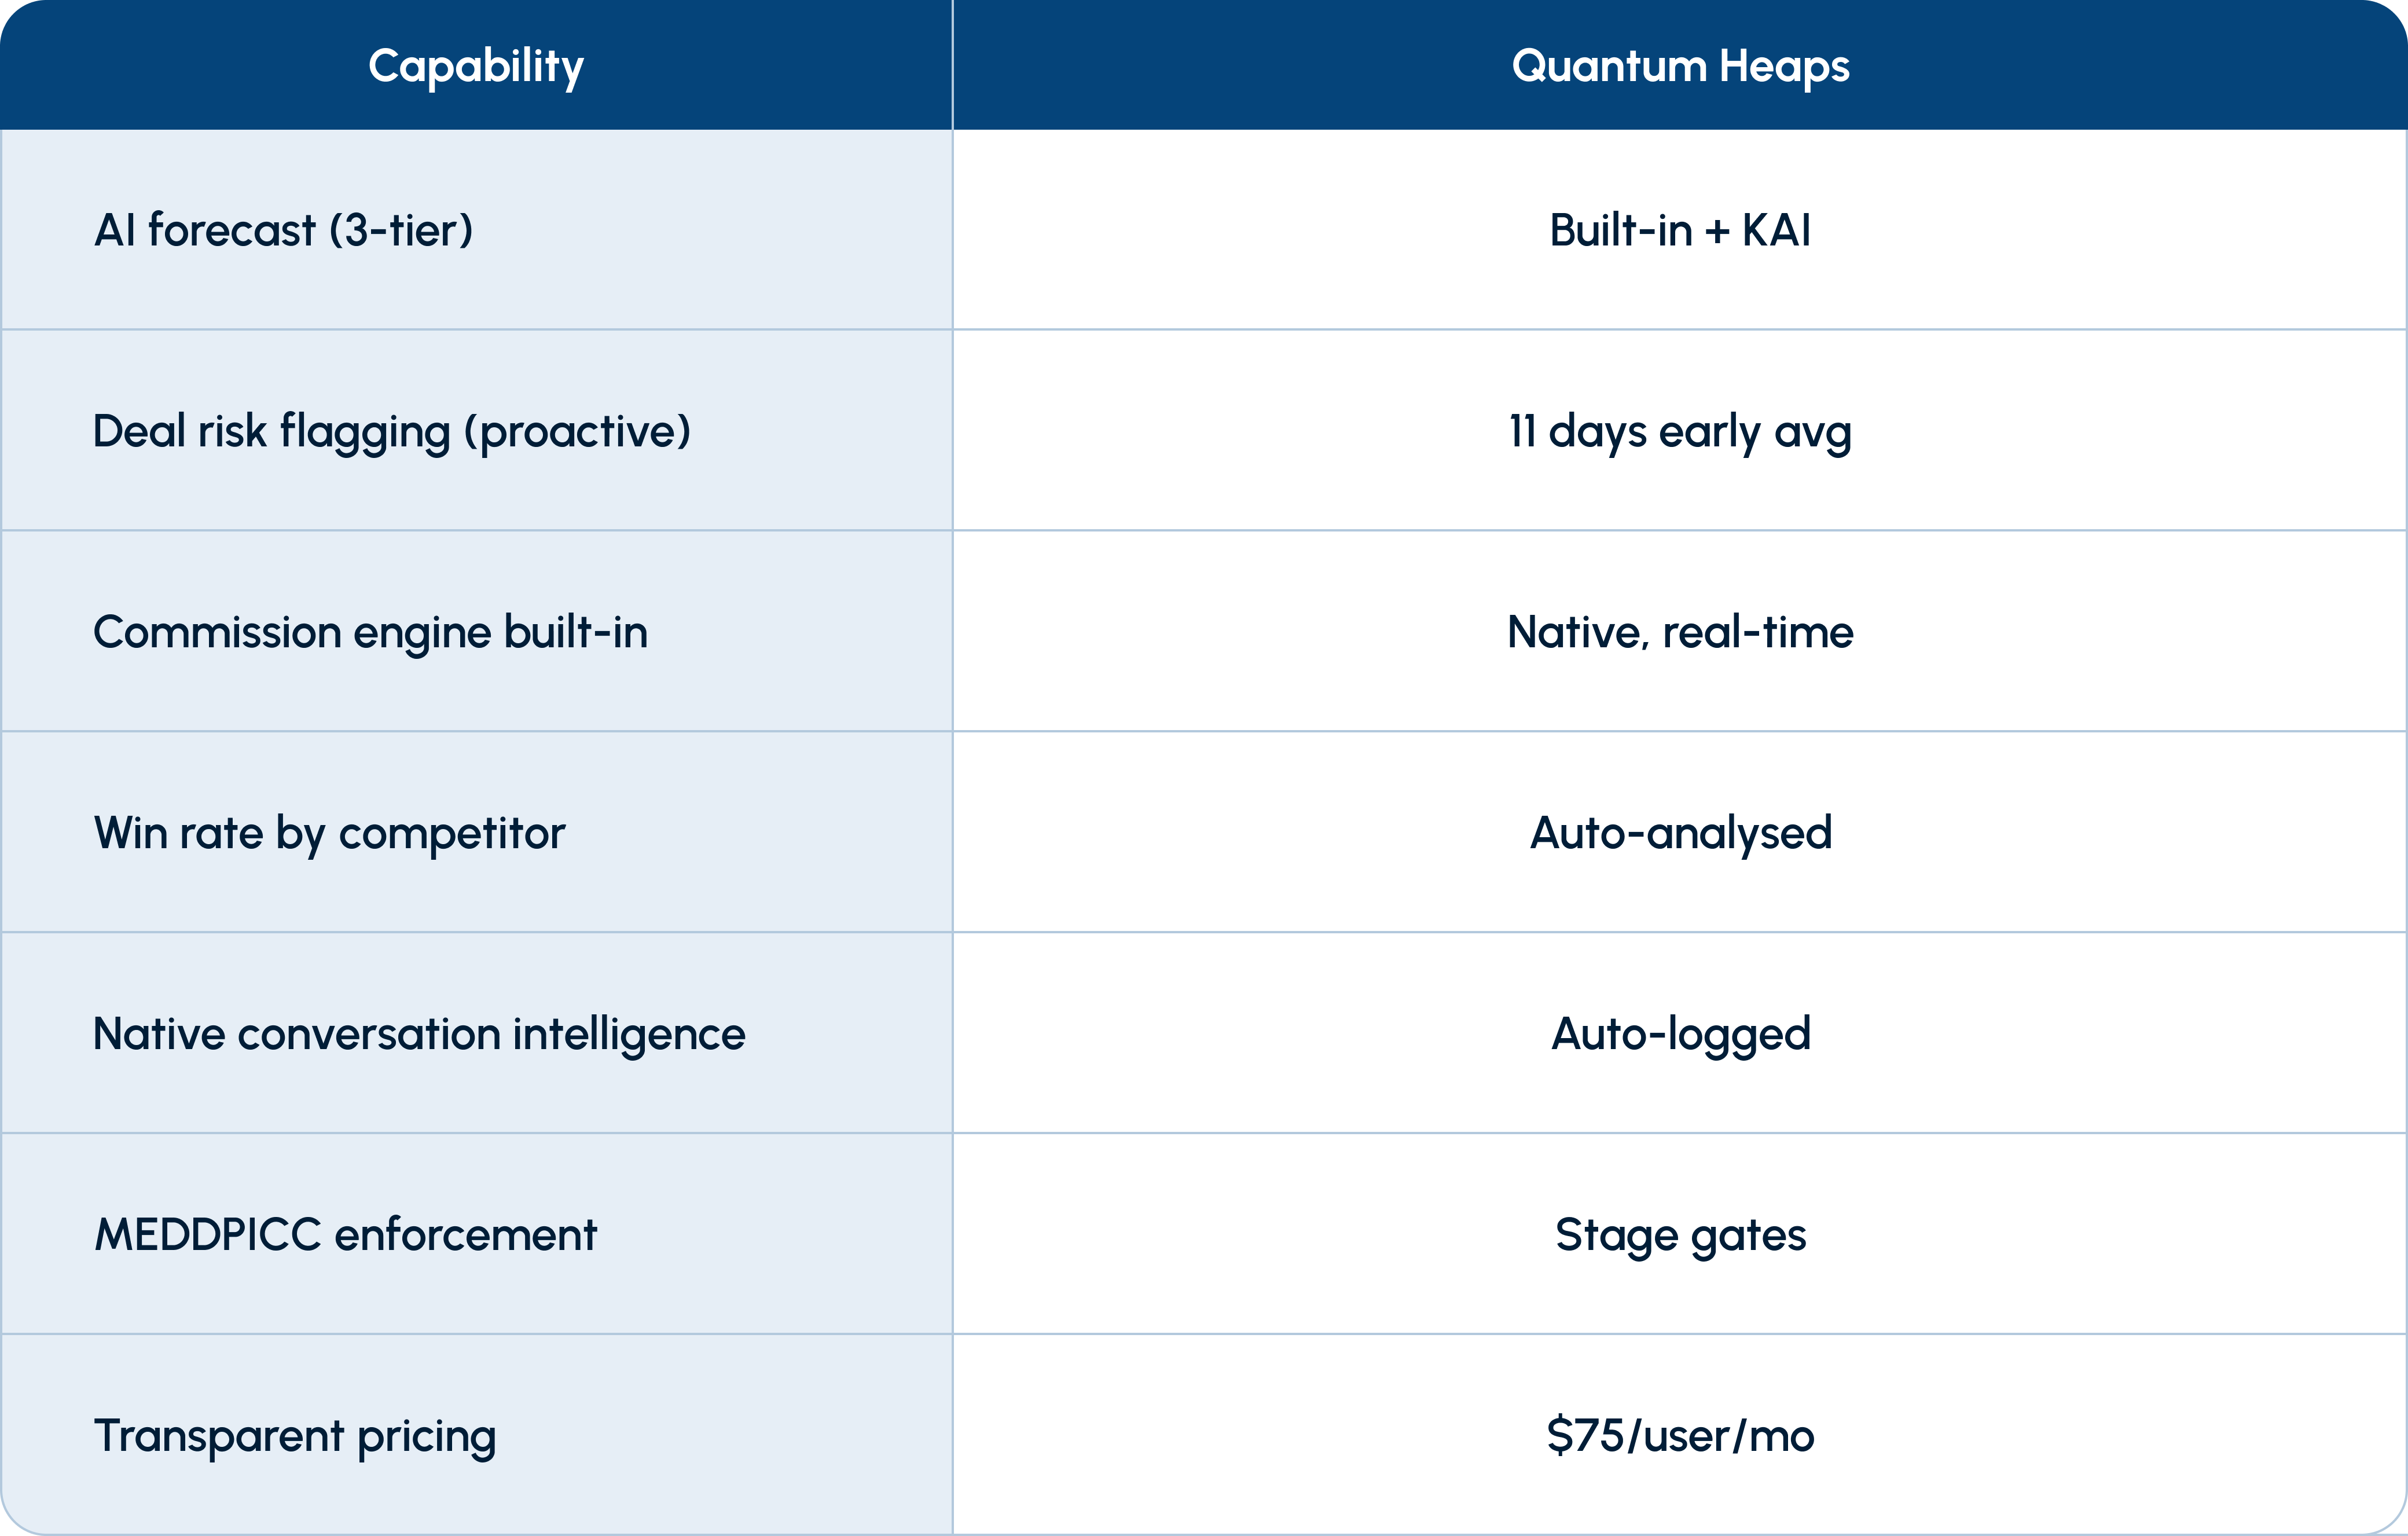
FULL CAPABILITY SET

Three-tier AI forecast with confidence scores, manager override tracking, and historical accuracy benchmarking.

Agent Q flags stalled deals, disengaged champions, and missing stakeholders – 11 days before they close lost.

Understand why deals close and why they don’t – by rep, competitor, stage, and deal size. No analyst required.

Understand why deals close and why they don’t – by rep, competitor, stage, and deal size. No analyst required.

Rep attainment vs ramped quota. Manager override accuracy. New hire vs veteran comparison. All normalised.

Forward-looking coverage for current and next quarter. Agent Q alerts when any territory drops below 3× threshold.
WHY QH VS ALTERNATIVES
READY TO TRUST YOUR FORECAST?
We’ll Run A Live Demo Using Your Actual Deal Data.
You’ll See Your Real Pipeline Through Q Intelligence’s Eyes.
To First Value
Forecast Accuracy
Commission Disputes
Cost Reduction
Adding {{itemName}} to cart
Added {{itemName}} to cart